Showing posts with label Environment. Show all posts

Tuesday, 13 September 2011

Quote: GK Chesterton from 'Orthodoxy'—Nature

The essence of all pantheism, evolutionism and modern cosmic religion is really in this proposition: that Nature is our mother. Unfortunately, if you regard Nature as a mother, you discover that she is a step-mother. The main point of Christianity was this: that Nature is not our mother: Nature is our sister. We can be proud of her beauty, since we have the same father; but she has no authority over us; we have to admire, but not to imitate. This gives to the typically Christian pleasure in this earth a strange touch of lightness that is almost frivolity. Nature was a solemn mother to the worshippers of Isis and Cybele. Nature was a solemn mother to Wordsworth or to Emerson. But Nature is not solemn to Francis of Assisi or to George Herbert. To St. Francis, Nature is a sister, and even a younger sister: a little, dancing sister, to be laughed at as well as loved.


Chesterton GK. 1908. Orthodoxy. Image, New York (2001 Edition)
Chapter VII: The Eternal Revolution. Page 115.

Thursday, 18 August 2011

Invertebrate Macro Photography


Earlier this year, I met up with up-and-coming New Zealand nature photography Bryce McQuillan, who specialises in macro photography of invertebrates, particularly spiders. He puts the majority of his photos on Flickr and are well worth checking out.

Nature photographers are uniquely able to capture and portray the beauty and wonder of the natural world, and communicate it to the public in a way that can be broadly appreciated. The photos of the chalcidoid wasp above and the entomobryoid springtail below demonstrate this. These invertebrates are minute and incredibly beautiful. They are common and widespread, but their small size means that most people are not aware of them. The adage of one picture being worth 1000 words is particularly relevant in this situation.

Bryce's favorite group are spiders, which are particularly needy in the PR department. His photographs are able to capture their beauty and personality in such a way that even those who have no natural fondness for spiders are able to see beyond their "creepy-crawly" facade.

And this is why nature photographers are so important. Photos are an acccessable medium that people are easily able to understand and relate to. They are vital in the communication of the importance of biodiversity to the general public.

Sunday, 7 August 2011

Pressing plants

Weevils feed on plants, with many species being very picky about the plants they eat. These host interactions are very important for understanding the ecology of both the weevils and the plants. When collecting therefore, it is important that the plants from which weevils have been collected are identified and noted. Therefore, as a weevil guy, it is important that I have a fair understanding of plant identification.

A key aspect of the process is knowing the proper way to collect, preserve and label plant specimens. Searching the internet has revealed good guides on the University of Florida Herbarium webpage and a PDF produced by the Herb Society of America.

It's not too arduous—pressing plant material can be done by placing the material under a few big books. Much more important is knowing what to put on the label. Plant specimens tend to be mounted on large (A3) sheets of paper, giving a lot of space to write pertinent information. Therefore, major additional categories from that on insect labels include its frequency (is it rare, common, or something in between?), and details of the plant's height, growth habit and description of aspects of the plant that disappear when pressed (e.g. colour of flowers, smell and sap). There's also the space and ability to provide exact locality data and more detailed habitat information than is possible with insect labels.

Sunday, 27 February 2011

Freely available Digital Elevation Models for New Zealand

For people wanting to view aspects of New Zealand's amazing topography, a number of Digital Elevation Models are freely available from Geographx, a company specialising in producing New Zealand geographic information and atlases. Thanks Geographx!

Monday, 24 January 2011

GIS Shapefile of DOC-administered land

The New Zealand Department of Conservation, fondly known as DOC is the department in charge of the bulk of New Zealand's publically owned land. Their best known pieces of real estate are the 14 national parks that conserve some of New Zealand's most iconic landscapes and least modified habitats. Less well known are the legion of scenic reserves and conservation areas that make up a substantial portion of our property. These smaller reserves are no less interesting, and tend to protect small but important areas of near-natural habitat, or intriguing aspects of New Zealand history. Until now, the main way of finding out about them is by stumbling across them while on a road trip, or by word-of-mouth. However, now DOC has released a GIS shapefile that shows the boundaries of all the conservation estate, along with information on what acts of parliament they're protected under and how large the reserve is.

It is important to note that this shapefile only shows those reserves in DOC's ownership and management. Thus, it does not show community-initiated reserves such as Maungatautari Ecological Island or QEII Covenants; nor does it show reserves owned by city councils, like the Auckland Regional Parks or Christchurch's Port Hills Reserves.

Sunday, 24 October 2010

Pacific Island Ecosystems at Risk (PIER)

Sphagneticola trilobata
The Pacific Island Ecosystems at Risk (PIER) website is an excellent resource to the weeds of importance throughout the tropical Pacific region. The main strength of the site is the extensive list of species fact sheets (including Sphagneticola trilobata, an important lowland weed in Western Viti Levu, Fiji; pictured above) It also includes assessments of the weed fauna of several Pacific Islands, primarily within Micronesia and Polynesia.

While on the subject, SPREP has published some guidelines for the management of invasive species in the Pacific, an important document for those dealing with such things in the region.

Wednesday, 8 September 2010

Canterbury Earthquakes part III

As more people keep following the GeoNet website, they are starting to notice the seismic activity in areas other than Christchurch. A few people I've talked to have expressed concern that the Saturday 7-pointer has sparked earthquakes around the country. This is incorrect, as earthquakes below magnitude 3 are extremely common and as can be seen in the plot below, they occur throughout the country.


A closer look at the magnitude of these earthquakes shows their temporal distribution is fairly uniform. What is interesting is that prior to the time of the big one there appears to be a lull in the frequency of lower-level earthquakes nation-wide. Is this at all significant? I don't know.


The magnitude follow a right-skewed normal distribution with a mean of 2.47 and a standard deviation of 0.617, while their depth follows an approximate Poisson distribution with a mean of 44 km.


Looking at the seismic activity within the Canterbury region, we see that earthquakes appear to have been fairly randomly distributed throughout the region until the 4 September quake. Only a single tremor was detected from the vicinity of the recently revealed fault, an insignificant 2.31 that occurred on the 21st of March. That there weren't more tremors closer to the time would seem to count against the hypothesis of big earthquakes being preceeded by smaller ones.


As before, data was gained from the Quake Search data download query provided by GNS, and the data, R code and a file giving the location of Canterbury towns is available for all.

Tuesday, 7 September 2010

Canterbury Earthquakes part II

Since posting last night, there's been several more aftershocks, including several big ones. The total now stands (at 7:00pm) at 304 aftershocks, 70 greater than 4 on the Richter scale, 29 greater than 4.5, and 10 greater than 5. A couple of the fives happened last night, waking us up, and causing more damage to several buildings around town.


This evening's installment is a map of the region of Canterbury where the earthquakes have been centred, showing the epicentre of all aftershocks and their magnitudes. It appears that while smaller tremours have been centred fairly widely, the larger magnitude earthquakes have been centred more around the epicentre of the initial 7.1 quake. As before, I've made the the data and R code available.

The region around the epicentre of the initial quake has been surveyed by GNS scientists. They've got some pretty awesome aerial photos showing the location of the fault on their webpage detailing their work.

Monday, 6 September 2010

Canterbury Earthquake

4:35 am on Saturday morning, I was woken up by a 7.1 magnitude earthquake, the epicentre being approximately 30 km west of where I live in Christchurch, New Zealand. The earthquake was one of the largest that New Zealand has experienced, and has been the most destructive one since the earthquake that struck Napier in 1931. Thankfully, the suburbs around the area that I live in suffered minimal damage, with most roads and houses essentially unscathed.

While the initial earthquake was fairly scary, it has been the aftershocks that have been the most unnerving. By this time we're starting to get fairly used to them, but they are still keeping all of us on edge. There's been a number, and now that I have access to the internet, I made it my mission to find out how many there's been thus far. The New Zealand Herald newspaper has published an online article showing the locations of all the aftershocks, but a bit scant on other details.

The New Zealand research institute Geological and Nuclear Sciences (GNS) is the primary monitor of New Zealand's earthquakes and makes all their data available online. In particular their Quake Search tool allows you to download CSV, KML and other files of any earthquakes that satisfy any given criteria. The GeoNet website in general is an excellent source of all sorts of information with regard to natural hazards in the New Zealand region.

I downloaded the data for the past week and started pulling out a bunch of trends. The two that I'll post here for now are the following:

Until 6 Sep 2010 19:03 NZST there has been 257 aftershocks, ranging between 2.4 and 5.4 on the Richter scale. Of these, there have been 64 with magnitudes above 4; 24 above 4.5; and 7 above 5. The average has been 3.6.


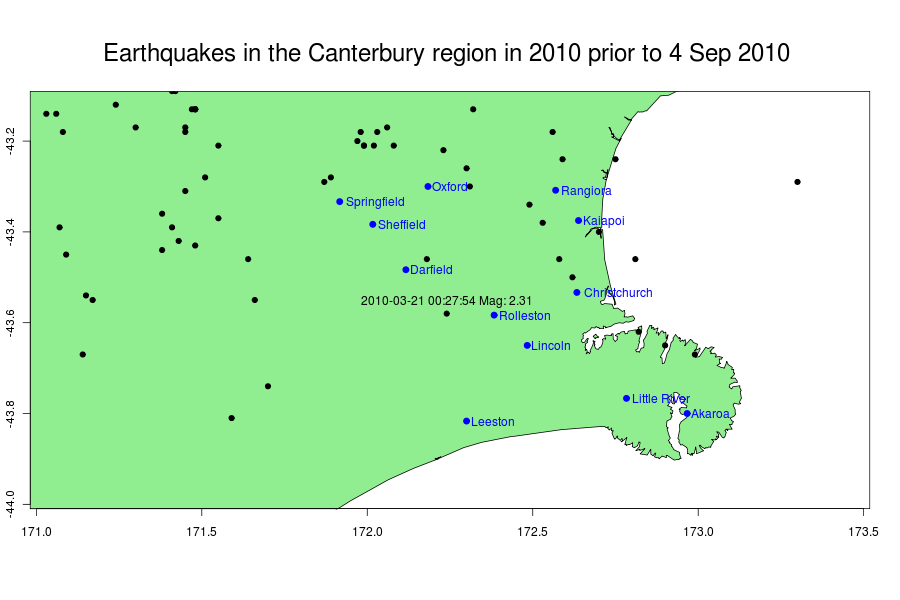
The comparison between the earthquakes recorded prior to and following the earthquake is remarkable. The four days prior to the earthquake there were no earthquakes originating within the Canterbury region (defined as being between 42--44 degrees S and 171--173 degrees E). Since Saturday morning, the region has been shaking like nothing else.


A line plot only of the Canterbury earthquakes does show that the aftershocks are lessening in frequency and intensity. Further playing around with the data and the plot might show this more effectively though.


A plot comparing the magnitude of each quake with its depth is quite interesting. The vast majority of the Canterbury earthquakes are fairly shallow (<20 km). Once again, further analysis will show if this is a significant thing or not, but it does explain why they've been so easily felt.

Feel free to look at the R code and the CSV file I used for the plots above.